
Am 24.06.2002 um 1823 UTC hob NOAA N auf der Spitze einer Titan II Trägerrakete der US-Luftwaffe von der Vandenberg Startrampe in Californien ab. Etwa 6 Minuten später trennte sich der Satellit von der zweiten Stufe der Titan II und umkreist nun die Erde in ca. 870 km Höhe auf einer sonnensynchronen Bahn. Deshalb sind die Satelliten immer zur gleichen Tages- bzw. Nachtzeit zu empfangen. Die Inklination beträgt ca. 98°, die Umlaufzeit 101 Minuten.
Kurz nach dem Start verfolgten die Flugleittechniker den Fortschritt des Raumfahrzeugs mit Echtzeittelemetriedaten, die vom amerikanischen Bahnverfolgungs- und Datenübermittlungssatellitensystem TDRS weitergeleitet wurden. Etwa 30 Minuten nach dem Start, erhielten die Techniker Daten des Satelliten über die Bodenstation im McMurdo Sund in der Antarktis, die besagten, das sich die Solarzellenflächen des Satelliten erfolgreich entfaltet hatten. Um 1949 UTC schließlich erreichten sie Daten von der Station Oakhanger in England, die bestätigten, daß das Energieversorgungssystem von NOAA-M normal funktionierte. NOAA-M wurde in NOAA-17 umbenannt, nachdem er die Umlaufbahn erreicht hatte.
Wie auch bei den zwei vorangegangenen Satelliten hat NOAA-17’s verbessertes Mikrowellenlot zusätzliche Kanäle, die eine verbesserte Temperatur- und Wasserdampfüberwachung in der Troposphäre und der Stratosphäre, besonders bei starker Bewölkung, ermöglichen. Sein fortschrittliches höchstauflösendes Radiometer besitzt einen neuen sechsten Kanal im sichtbaren Bereich, mit dem es möglich ist, zwischen Wolken und Schnee/Eis auf dem Boden zu unterscheiden. Nach etwa 21 Tagen wird die NASA die Betriebssteuerung des Satelliten an die NOAA übergeben. Die gesamte In-Orbit Daten- und Instrumentenüberprüfung der NASA wird voraussichtlich um die 45 Tage dauern.
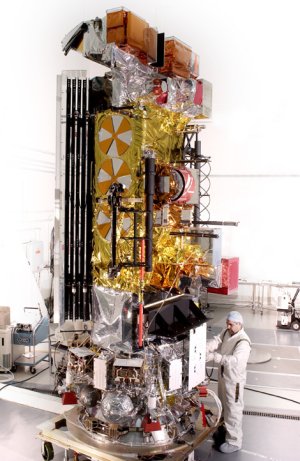
Der NOAA-17 Satellit wurde von Lockheed Martin Raumfahrtsysteme in Sunnyvale, Kalifornien gebaut und vom Goddard Raumflugzentrum der NASA für die nationale Behörde für Meeres und Atmosphärenforschung gestartet. Wie auch die anderen NOAA Satelliten wird NOAA-17 meteorologische Daten sammeln und die Informationen zu Benutzern auf der ganzen Welt übermitteln um so die Wettervorhersage zu verbessern. In den USA werden die Daten vornehmlich vom nationalen Wetterdienst der NOAA für ihre Langzeit Wetter- und Klimavorhersagen genutzt. Daten vom NOAA Satelliten werden auch von Wissenschaftlern innerhalb NASAs geowissenschaftlichen Initiative verwendet, um unseren Heimatplaneten besser verstehen und schützen zu können.
Quelle: NASA/KSC
Orbital Parameter
Name                   NOAA-17
NORAD                  27453
COSPAR Bezeichnung     2002-032-A
Inklination (Grad)     98.390
RAAN                   126.948
Excentrizität          0.0012304
ARGP                   42.170
Umläufe pro Tag        14.24248645
Periode                1h 41m 06s (101.10 Min)
Semi-major axis        7189 km
Perigäum x Apogäum     802 x 820 km
Mean Anomaly           318.044
Downlink
APT: 137.500 MHz
HRPT: 1701.0 MHz
Status
Following almost 11.5 years of service NOAA-17 (NOAA-M prior to launch) was decommissioned on REV 56109 at 10 April 2013 at 1216 UTC.
NOAA-17 AVHRR scan motor operation became erratic on Sep. 28 often indicating motor current saturating to 271 mA. It finally ceased to operate indicatting a stall condition at 271 mA on Oct.15, 2010.

06.12.2010
Archive
See some history here: https://www.satblog.info/?s=NOAA-17&x=-1244&y=-102

so klingt das APT-Signal eines NOAA-Satelliten (137 MHz)
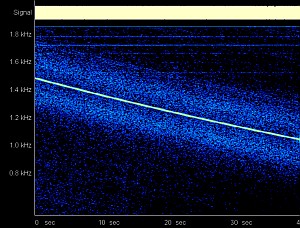
Bakensignal der POES Satelliten auf 137.350 MHz (USB ohne Dopplerkorrektur)
NF-Spektrum der TIP Data (TIROS Information Processor) Bake auf 137.35 MHz, 8,320 kbps split phase,
PM +/- 67°
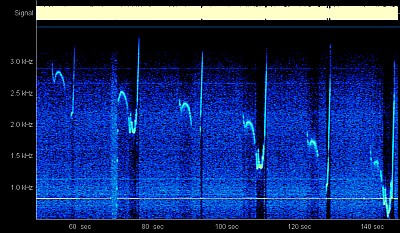
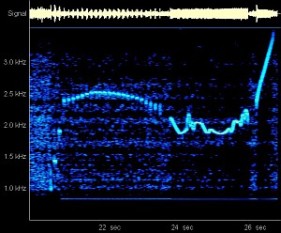
Bakensignal der POES Satelliten auf 137.770 MHz (USB)
NF-Spektrum der TIP Data (TIROS Information Processor) Bake auf 137.77 MHz, 8,320 kbps split phase,
PM +/- 67° und ein einzelner Datenburst
detaillierte Beschreibungen
Übersicht / Grundlagen der NOAA-Serie (NOAA Instrumente)
Die Empfangsanlage für APT Aussendungen der Wettersatelliten
APT- und HRPT Aussendung der NOAA Satelliten
NOAA APT Bildverarbeitung
Vergleich der NOAA Passes mit Elevationen größer 45° über Deutschland im Jahresverlauf
Logbuch und aktuelle Informationen
 Aktuelle Satellitenbilder und Statusinformationen in meinem SatBlog -> NOAA

September 2002
Seit dem 24.09.2002 werden die “normalen” APT-Kanäle gesendet, d.h. tagsüber Ch #2 und Ch #4, nachts Ch #3B und Ch #4.
Start der Aufzeichnung am 24.05.2005, 1942 UTC
2 IR Kanäle / Umschaltung eines IR in VIS Kanal um 1952 UTC
Umschaltung um 1952 UTC IR -> VIS; Umschaltung an der Illuminationsgrenze
Juli 2005
Vom 03.-05.07.2005, wurden keine APT-Signale empfangen. Es lag ein Softwareproblem vor. Die Stromzuführung des VTX-2 (137.62 MHz APT Data) schaltete sich ab, wenn das CDA System (Command and Data Acquisition) aktiv war.
March 2010
NOAA 17 has scan motor problems with rising motor currents. Constant rephase by the MIRP is causing data dropouts on all the HRPT stream and APT and GAC derivatives. Auto re-phase will be disabled in Calendar Week 14 (08.-12.03.2010) to study extent of problem and to allow a solution to be engineered if possible.

NOAA-17 IR (night) image from today, 19:36 UTC (SatSignal)
NOAA analysis: mean signal: 2987.24
  832 Hz tone: average: 0.134 (req: 0.015),  peak: 0.347 (req: 0.055)
  analyser recognised NOAA APT
Net signal analysis time: 178 msec
ACF (for plot) analysis time: 6 msec.
NOAA sync loss at line 46, relock after 0.334 seconds
NOAA sync loss at line 116, relock after 0.335 seconds
NOAA sync loss at line 160, relock after 0.168 seconds
NOAA sync loss at line 228, relock after 0.334 seconds
NOAA sync loss at line 250, relock after 0.335 seconds
NOAA sync loss at line 288, relock after 0.335 seconds
NOAA sync loss at line 328, relock after 0.168 seconds
NOAA sync loss at line 395, relock after 0.334 seconds
NOAA sync loss at line 490, relock after 0.334 seconds
NOAA sync loss at line 568, relock after 0.461 seconds
NOAA sync loss at line 570, relock after 0.461 seconds
NOAA sync loss at line 573, relock after 0.261 seconds
NOAA sync loss at line 575, relock after 0.371 seconds
NOAA sync loss at line 577, relock after 0.461 seconds
NOAA sync loss at line 579, relock after 0.083 seconds
NOAA sync loss at line 580, relock after 0.295 seconds
NOAA sync loss at line 582, relock after 0.421 seconds
NOAA sync loss at line 616, relock after 0.501 seconds
Signal level is OK
NOAA: From wedge telemetry channel A is AVHRR sensor 2 (0.86um visible)
NOAA: From wedge telemetry channel B is AVHRR sensor 3B (3.7um mid-IR)
NOAA: Chan A is all sensor 3

NOAA-17 image from March 06, 2010 09:00 UTC (WXtoImg)
October 2010
NOAA engineers are currently looking at a contingency plan for the NOAA-17 AVHRR anomaly. In the meeting this morning the engineering staff are considering to changing HRPT transmitters on NOAA-16 to a RHCP antenna so that users can use their current configuration. Also NOAA has express interest in changing the APT transmitter on NOAA-17 back to 137.620 but leave NOAA-15’s APT transmitter alone. Another option that NOAA is exploring is to try a last attempt to revive the APT system on NOAA-16 but engineers have stated that due to the hybrid failure that connects the to VTX transmitter to the antenna that its probably unlikely that it would ever recover. In the mean time NOAA is making plans to make the LRIT data from METOP covering both East and West coasts of the United States available via the data collection system. More on this when a process is defined in greater detail. NOAA is comparing the current situation with the one that occurred on NOAA-14 many years ago to see if any of the procedures used then could be applied in this case. The data obtained from the PACS system show similar signature in the current draw and base plate temperature but the way the anomaly presented itself in the past few months may make it impossible to determine if anything could be done. This may be a wait and see game like before. Over the next few days NOAA will make and evaluation of the anomaly and report to the users what the plan of attack will be. They ask that we all be patient while the process take place and are doing their best to fill the gap caused by this failure. I should more to pass over to you all in the coming days.

20.10.2010 at 08:27 UTC
Empfangene und aufgearbeitete APT Bilder

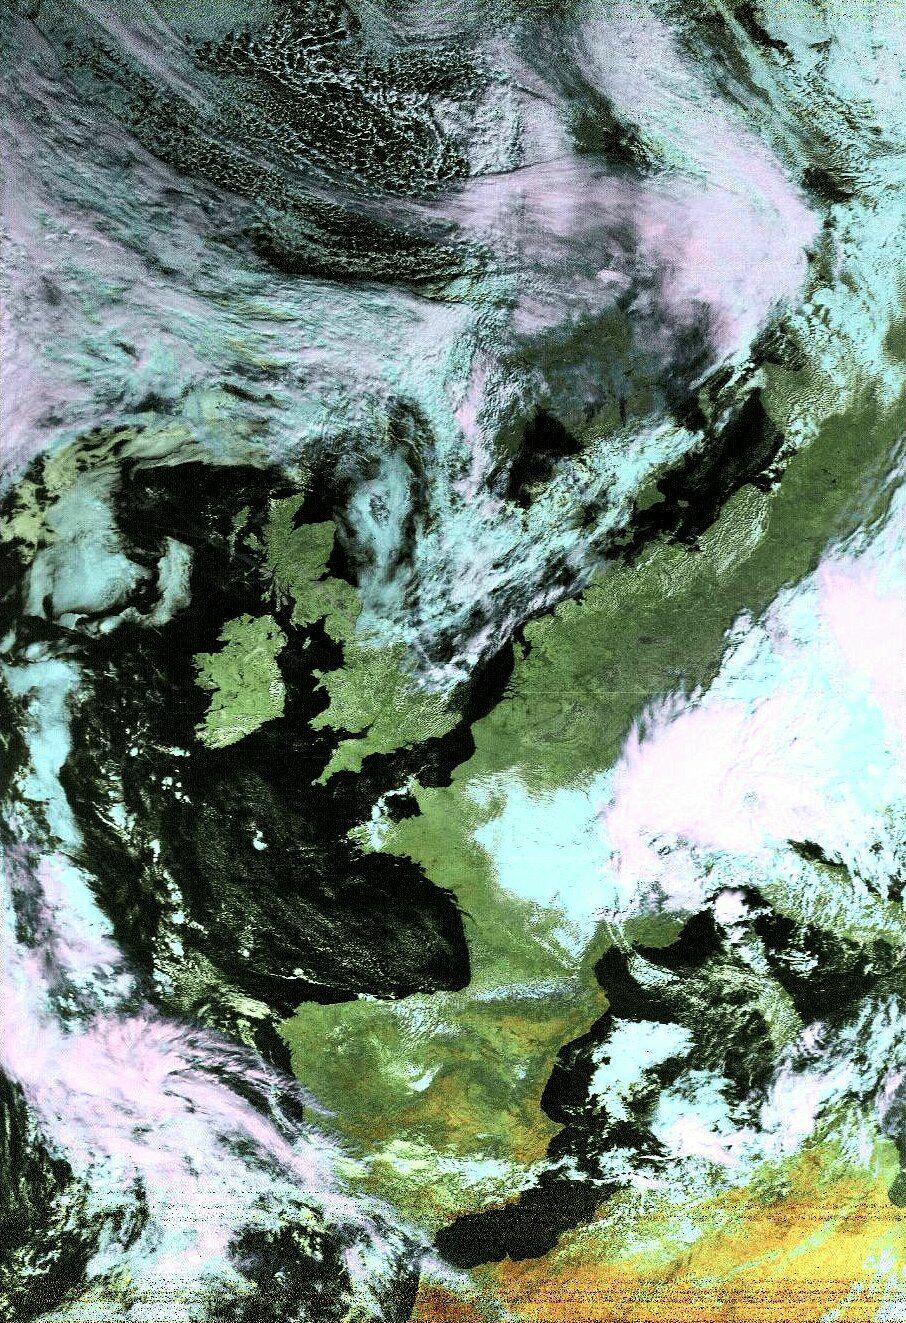

Sommerbilder (links) und Aufnahmen im Winter (rechts)

Ausschnitt NOAA-17 24.06.2005 0948 UTC

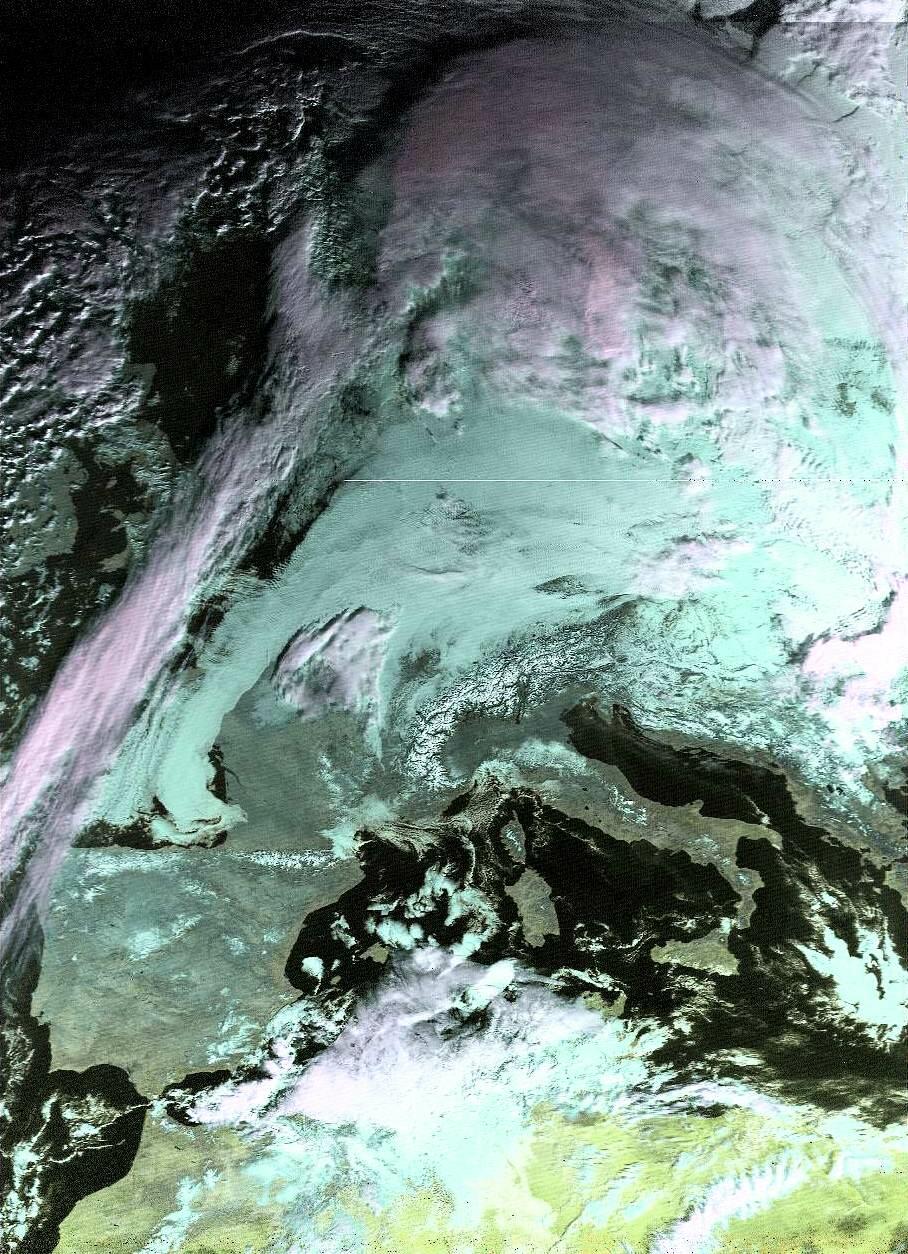
NOAA-17 Schwarzes Meer, östliches Mittelmeer, Türkei, Syrien, Jordanien am 23.06.2005 0831UTC
Ländergrenzen eingeblendet
Links
POES Status
Daily News Report
General Satellite Messages (daily updated)